The Role of Data Visualizations in Enhancing Research Impact
In today's fast-paced world, where information overload is the norm, the way we present research findings can make all the difference. Data visualizations play a crucial role in transforming complex data into engaging visuals that communicate insights effectively. Imagine trying to explain a complicated concept without any visuals; it would be like trying to navigate through a dense fog without a map. That's where data visualizations come into play, acting as a beacon that guides audiences through the intricate landscape of research results.
Research is not just about collecting data; it's about sharing knowledge and making an impact. When researchers present their findings, they want to ensure that their audience understands and retains the information. This is where the magic of visual storytelling happens. By using graphs, charts, and infographics, researchers can highlight key trends and patterns in their data, making complex information more digestible. In essence, data visualizations are not just supplementary; they are essential tools that enhance the overall research narrative.
Moreover, the impact of research often hinges on its accessibility. How many times have you come across a dense report filled with jargon and numbers that made your eyes glaze over? Effective data visualizations cut through the noise, providing clarity and focus. They allow researchers to reach a broader audience, from academics to policymakers and even the general public. By making research findings visually appealing and easy to understand, researchers can foster greater engagement and drive meaningful conversations around their work.
The importance of data visualizations cannot be overstated. They serve as a bridge between complex research and actionable insights, ensuring that findings resonate with diverse audiences. Whether it's through a simple bar chart showing survey results or an interactive dashboard that allows users to explore data dynamically, these visual aids are pivotal in enhancing the impact of research. As we delve deeper into the various types of data visualizations, we will see how each serves a unique purpose in the grand tapestry of research communication.
Data visualization transforms complex data into understandable visuals, facilitating better comprehension and retention of information, ultimately enhancing the research's impact on its audience.
Different types of data visualizations serve various purposes, from charts and graphs to infographics and dashboards. Each type has unique strengths in conveying specific types of research data effectively.
Charts and graphs are fundamental tools in data visualization, providing clear representations of numerical data, trends, and comparisons, thereby aiding in the interpretation of research findings.
Bar charts are particularly effective for comparing quantities across different categories, making them ideal for displaying survey results or experimental data in research.
Line graphs are useful for illustrating trends over time, allowing researchers to present changes in data points and analyze patterns effectively.
Infographics combine visuals and text to tell a story, making complex information more digestible and engaging, which is crucial for reaching broader audiences in research dissemination.
Effective data visualizations capture attention and engage audiences, encouraging them to explore research findings further and fostering a deeper understanding of the subject matter.
Interactive visualizations allow users to manipulate data and explore different scenarios, increasing engagement and providing personalized insights into research findings.
Creating accessible data visualizations ensures that all audiences, including those with disabilities, can engage with research content, broadening its reach and impact.
Adhering to best practices in design and data representation enhances the clarity and effectiveness of visualizations, ensuring that they serve their intended purpose in research communication.
Keeping visualizations simple and clear helps prevent information overload, allowing the audience to focus on the key messages and insights from the research.
Thoughtful color and design choices improve the aesthetics and readability of visualizations, making them more appealing and easier to interpret for a diverse audience.
- What is the main purpose of data visualization? Data visualization aims to make complex data more understandable and accessible, enabling better communication of research findings.
- How can I create effective visualizations? Focus on simplicity, clarity, and the appropriate use of colors and design elements to enhance readability and engagement.
- Are interactive visualizations more effective? Yes, interactive visualizations can significantly increase audience engagement by allowing users to explore data in a personalized manner.

The Importance of Data Visualization
Data visualization is not just a fancy way to present information; it’s a transformative tool that turns complex datasets into visual formats that are easy to understand. Imagine trying to navigate through a dense forest of numbers and statistics without a map. That’s what raw data feels like to most people. By utilizing data visualizations, researchers can create a clear path through that forest, guiding their audience to the insights that matter most.
One of the key benefits of data visualization is its ability to enhance comprehension. When we see information represented visually, whether through bar charts, pie graphs, or infographics, our brains process that information faster and more effectively. This is particularly crucial in research, where findings need to be communicated to various audiences, from fellow scientists to the general public. A well-designed visualization can make the difference between a concept that is easily grasped and one that is lost in translation.
Furthermore, data visualization plays a significant role in information retention. Studies show that people are more likely to remember information presented visually compared to text alone. This is because visuals engage both the analytical and creative parts of our brains, providing a holistic understanding of the data. For instance, consider how a colorful infographic can stick in your mind much longer than a paragraph filled with statistics. This retention aspect is vital in research dissemination, as it ensures that key findings are not only understood but also remembered.
In addition to comprehension and retention, data visualization can also enhance engagement. When presented with compelling visuals, audiences are more likely to interact with the content. They might ask questions, seek further information, or even share the findings with others. This engagement is essential for researchers who want their work to have a broader impact. After all, what good is groundbreaking research if it remains hidden in academic journals, unread and unacknowledged?
To illustrate the importance of data visualization further, let’s look at a comparison of traditional text-based reporting versus visual representation in research communication:
| Aspect | Text-Based Reporting | Data Visualization |
|---|---|---|
| Comprehension | Often requires multiple readings to understand | Quickly conveys information at a glance |
| Retention | Low retention rates | Higher retention due to visual memory |
| Engagement | Passive reading experience | Interactive and engaging experience |
In summary, the importance of data visualization in research cannot be overstated. It transforms dense information into accessible formats, enhances understanding and retention, and fosters engagement. As researchers strive to communicate their findings effectively, embracing the power of data visualization is not just beneficial; it’s essential for maximizing impact and reaching diverse audiences.

When it comes to presenting research findings, the type of data visualization you choose can make a world of difference. Each visualization type has its unique strengths, tailored to convey specific kinds of information effectively. Imagine trying to explain a complex concept without the right tools—it's like trying to build a house without a hammer! In the realm of data visualization, we have a toolbox filled with various instruments like charts, graphs, infographics, and dashboards. Each of these serves a distinct purpose and can significantly enhance the clarity of your research.
Let's dive deeper into some of the most common types of data visualizations:
Charts and graphs are the backbone of data visualization. They provide clear representations of numerical data, trends, and comparisons, making it easier for audiences to interpret research findings. Think of them as the bridge that connects complex data to a broader understanding. Here are a couple of popular chart types:
Bar charts are particularly effective when you want to compare quantities across different categories. They visually represent data in rectangular bars, where the length of each bar correlates with the value it represents. This makes them ideal for displaying survey results or experimental data in research. For instance, if you were comparing the effectiveness of different teaching methods, a bar chart could clearly show which method yielded the best results.
On the other hand, line graphs are fantastic for illustrating trends over time. They allow researchers to present changes in data points and analyze patterns effectively. Picture a roller coaster—each dip and rise represents fluctuations in data, helping viewers visualize how something has evolved over a specific period. Whether it's tracking climate change or monitoring stock prices, line graphs can tell a compelling story of progression.
Infographics take data visualization to another level by combining visuals and text to tell a story. They make complex information more digestible and engaging, which is crucial for reaching broader audiences in research dissemination. An infographic can transform a daunting pile of statistics into a captivating visual narrative that draws the reader in. By using icons, images, and concise text, infographics can convey messages quickly and effectively, making them perfect for social media sharing or public presentations.
In summary, the types of data visualizations you choose can significantly impact how your research is perceived and understood. By utilizing the right tools, you can transform intricate data into something that resonates with your audience, enhancing their engagement and comprehension.

Charts and Graphs
Charts and graphs are the backbone of data visualization, acting as the bridge between complex data sets and easy-to-understand insights. Imagine trying to explain your favorite sports team's performance over the season using nothing but numbers. It would be like trying to paint a picture with just a few colors, wouldn't it? That's where charts and graphs come in, transforming those raw numbers into vibrant visuals that tell a story. By presenting data in a graphical format, researchers can highlight trends, comparisons, and relationships that might otherwise be buried in a spreadsheet.
Let's dive a bit deeper into the different types of charts and graphs that researchers often use:
- Bar Charts: These are particularly effective for comparing quantities across different categories. For instance, if a researcher conducted a survey on people's favorite fruits, a bar chart could clearly display how many people preferred apples over oranges, bananas, or grapes.
- Line Graphs: Perfect for illustrating trends over time, line graphs allow researchers to present changes in data points clearly. Picture a line graph showing the rise in temperature over the years; it visually captures the essence of climate change, making the data more relatable.
- Pie Charts: While not as commonly used in academic research, pie charts can be effective for showing proportions. For example, if you wanted to illustrate the market share of different smartphone brands, a pie chart would provide a quick visual representation of each brand's slice of the market.
Each type of chart or graph serves a unique purpose, and the choice of which to use can significantly impact how the audience interprets the data. A well-designed bar chart can make a compelling argument at a glance, while a line graph can narrate a story of change that unfolds over time. The key is to select the right visual tool that aligns with the research objectives and effectively communicates the findings to the target audience.
Moreover, it's essential to ensure that these visualizations are not just aesthetically pleasing but also accurate and honest. Misleading graphs can distort the message and lead to incorrect conclusions. Therefore, researchers must adhere to best practices in data representation, ensuring that every chart and graph is a true reflection of the underlying data.
Q: What are the most common types of charts used in research?
A: The most common types include bar charts, line graphs, pie charts, and scatter plots. Each serves a different purpose based on the type of data being presented.
Q: How can I choose the best type of chart for my data?
A: Consider what you want to communicate. If you're comparing categories, a bar chart might be best. If you're showing trends over time, opt for a line graph.
Q: Are there tools available for creating data visualizations?
A: Yes, there are many tools available, such as Tableau, Microsoft Excel, and Google Charts, which can help you create effective and visually appealing charts and graphs.

Bar Charts
Bar charts are one of the most effective tools in the arsenal of data visualization. They allow researchers to present data in a way that is not only visually appealing but also easy to interpret. Imagine trying to explain the results of a survey to your friends without any visuals—confusing, right? That's where bar charts come in, turning complex numbers into a straightforward comparison. By displaying data as rectangular bars, with the length of each bar representing the value of the category it represents, bar charts provide an immediate visual impact that can quickly convey differences and trends.
These charts are particularly useful when you need to compare quantities across different categories. For instance, if you're presenting the results of a study on consumer preferences across various brands, a bar chart allows your audience to see at a glance how each brand stacks up against the others. Not only does this foster better understanding, but it also enhances retention of the information presented. Here’s a quick breakdown of why bar charts are so valuable:
- Easy Comparisons: Bar charts make it simple to compare multiple categories side by side.
- Clear Representation: The visual nature of bar charts helps in quickly grasping the differences in data.
- Versatility: They can be used for various types of data, whether nominal or ordinal.
Moreover, bar charts can be customized in numerous ways to fit the research context. You can use horizontal or vertical bars depending on the data's nature or the space available. Additionally, incorporating colors can enhance the chart's effectiveness, allowing for quick differentiation between categories. For example, you might use a different color for each brand in your consumer preference study to make it even easier for your audience to follow along.
In summary, bar charts are not just a pretty face in the world of data visualization; they are a powerful tool that can significantly enhance the communication of research findings. By simplifying complex data into a format that is both engaging and easy to understand, bar charts help researchers make their findings more accessible to a wider audience. So, the next time you're faced with a pile of data, consider turning it into a bar chart—your audience will thank you!
What are the advantages of using bar charts?
Bar charts provide clear visual comparisons, making it easy to interpret differences between categories. They are versatile and can display both nominal and ordinal data effectively.
Can bar charts be used for large datasets?
Yes, bar charts can handle large datasets, but it's essential to limit the number of categories displayed to avoid clutter and confusion. If too many bars are included, consider grouping similar categories or using a different type of visualization.
What is the difference between horizontal and vertical bar charts?
Horizontal bar charts are often used when category names are long or when there are many categories, as they provide more space for labels. Vertical bar charts are typically used when comparing fewer categories or when displaying time series data.

Line Graphs
Line graphs are a powerful tool in the realm of data visualization, particularly when it comes to illustrating trends over time. Imagine you’re tracking the growth of a plant; each week, you measure its height and jot down the numbers. If you were to plot these measurements on a line graph, you would create a visual representation that clearly shows how the plant grows week by week. This visual not only makes the data easier to digest but also allows viewers to quickly grasp the rate of growth and any fluctuations that might occur.
One of the standout features of line graphs is their ability to connect individual data points with a continuous line, which effectively communicates trends and patterns. For instance, if researchers are studying the effects of a new medication, they might use a line graph to display patient recovery times over several months. This visual approach can reveal critical insights, such as whether patients are improving steadily or if there are periods of stagnation that warrant further investigation.
When creating line graphs, it's essential to consider a few key elements to maximize their effectiveness:
- Axes Labeling: Clearly label both the x-axis (typically representing time) and the y-axis (usually representing the variable being measured). This ensures that viewers can easily interpret the data.
- Data Points: Use distinct markers for each data point to enhance visibility, especially when multiple lines are present in the same graph.
- Color Coding: Different colors for different lines can help differentiate between multiple datasets, making it easier for the audience to draw comparisons.
Moreover, line graphs can be particularly beneficial in presentations or reports where clarity and impact are crucial. By transforming raw data into a visual format, researchers can not only enhance understanding but also foster a more engaging experience for their audience. Just as a well-composed piece of music can evoke emotions, a well-crafted line graph can tell a compelling story about the data it represents.
In conclusion, line graphs are more than just a collection of points on a grid; they are a dynamic way to visualize change and convey complex information in an accessible manner. Their ability to illustrate trends, compare multiple datasets, and engage viewers makes them an indispensable tool in the arsenal of data visualization.
- What are line graphs used for? Line graphs are primarily used to show trends over time, allowing viewers to easily identify patterns and changes in data.
- How do I create a line graph? You can create a line graph using various software tools like Excel, Google Sheets, or specialized data visualization software by inputting your data points and selecting the line graph option.
- What should I include in a line graph? Ensure you include labeled axes, a clear title, and distinct markers for data points to enhance readability.

Infographics
Infographics are a powerful tool in the realm of data visualization, seamlessly blending visual elements with concise text to narrate a compelling story. They serve as a bridge between complex data and the audience's understanding, transforming intricate information into a format that is not just digestible but also visually appealing. Imagine trying to explain a complex research study filled with numbers and jargon; it can feel like trying to navigate a maze without a map. This is where infographics come into play, acting as that much-needed guide that simplifies the journey.
The beauty of infographics lies in their ability to convey messages quickly and effectively. In a world where attention spans are dwindling and information overload is rampant, infographics stand out by delivering key insights at a glance. They utilize a combination of charts, icons, and illustrations to highlight essential data points, making it easier for audiences to grasp the main ideas without wading through dense text. For instance, a well-designed infographic can summarize a research study's findings in a way that is not only informative but also engaging, encouraging viewers to delve deeper into the subject matter.
Moreover, infographics are incredibly versatile. They can be used in various contexts, from academic publications to social media posts, reaching a diverse audience. By employing a mix of colors, shapes, and layouts, infographics can evoke emotions and draw the viewer's eye to critical information. Consider the following components that make up an effective infographic:
- Clear Headings: These guide the viewer through the information.
- Visual Hierarchy: Important data should stand out, drawing attention immediately.
- Consistent Color Scheme: This enhances readability and aesthetic appeal.
- Engaging Graphics: Icons and illustrations that resonate with the content can make complex data relatable.
In addition to their aesthetic appeal, infographics also enhance information retention. Research shows that people are more likely to remember information presented visually compared to text alone. This is crucial in research dissemination, where the goal is not just to share findings but to ensure they are remembered and acted upon. By utilizing infographics, researchers can significantly increase the chances that their work will resonate with the audience, leading to greater impact and engagement.
In conclusion, infographics are more than just pretty pictures; they are a strategic tool in the arsenal of data visualization. By simplifying complex information and making it accessible, they play a vital role in enhancing the communication of research findings. As we continue to navigate an increasingly data-driven world, the importance of effective data visualization, particularly through infographics, cannot be overstated.

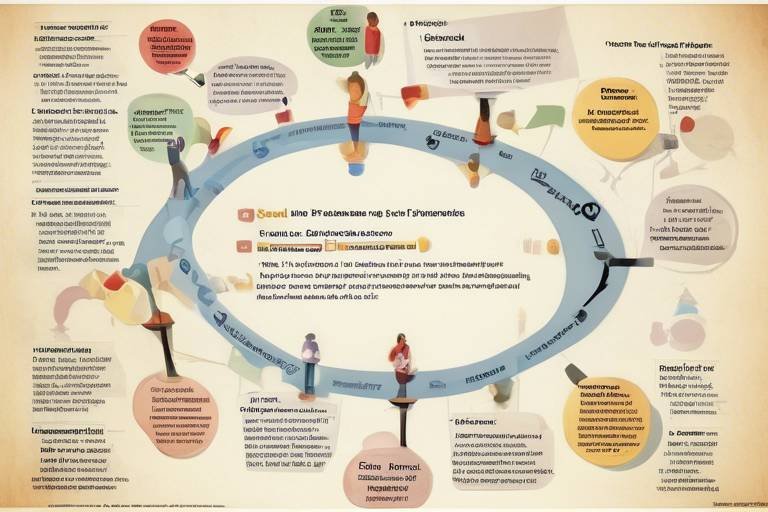
Enhancing Audience Engagement
When it comes to research, the challenge often lies not just in the findings themselves, but in how those findings are communicated. This is where data visualizations come into play, acting as a bridge between complex data and the audience's understanding. Imagine trying to explain a complicated concept without any visuals; it can feel like trying to navigate a maze blindfolded. By utilizing effective visualizations, researchers can not only capture attention but also spark curiosity, encouraging audiences to dig deeper into the research findings.
One of the most exciting developments in data visualizations is the rise of interactive visualizations. These dynamic tools allow users to engage with the data on a personal level, transforming passive viewing into an immersive experience. For instance, consider a dashboard that lets users filter data based on their interests or manipulate variables to see how outcomes change. This level of interactivity not only enhances engagement but also fosters a sense of ownership over the information being presented. Users are more likely to remember insights when they have played a role in discovering them.
Moreover, accessibility is a key factor in enhancing audience engagement. Creating visualizations that cater to a diverse audience, including individuals with disabilities, broadens the reach of research findings. For example, using alt text for images and ensuring color contrast is sufficient for those with visual impairments can make a significant difference. By prioritizing accessibility, researchers can ensure that their work resonates with a wider audience, ultimately amplifying its impact.
To illustrate the significance of audience engagement through data visualizations, let’s look at a few key benefits:
- Increased Retention: Visuals help audiences remember information better than text alone.
- Enhanced Understanding: Complex data becomes digestible, allowing for easier comprehension.
- Broader Reach: Engaging visuals attract diverse audiences, extending the research's influence.
In conclusion, engaging your audience through effective data visualizations is not just about presenting information; it's about crafting a narrative that resonates. By leveraging interactivity and ensuring accessibility, researchers can transform their findings from mere numbers into compelling stories that captivate and inform. The next time you think about sharing your research, remember: it's not just what you say, but how you say it that makes all the difference.
Q1: What are data visualizations?
Data visualizations are graphical representations of information and data. They use visual elements like charts, graphs, and maps to make complex data more understandable and accessible.
Q2: How do interactive visualizations enhance engagement?
Interactive visualizations allow users to explore data by manipulating it, which makes the experience more engaging and personal. This hands-on approach fosters deeper understanding and retention of the information presented.
Q3: Why is accessibility important in data visualizations?
Accessibility ensures that all individuals, regardless of their abilities, can engage with and understand the research findings. This inclusivity broadens the audience and enhances the impact of the research.
Q4: What are some best practices for creating effective data visualizations?
Best practices include maintaining simplicity and clarity, choosing appropriate colors and designs, and ensuring accessibility for all users. These elements help convey the intended message without overwhelming the audience.

Interactive Visualizations
In today's data-driven world, have emerged as a game-changer in the way we communicate research findings. Unlike static charts or graphs, interactive visualizations invite users to engage directly with the data, allowing them to explore different facets of the information presented. Imagine walking into a museum where you can not only look at exhibits but also interact with them—this is the essence of what interactive visualizations offer. They transform passive viewers into active participants, creating a more immersive experience.
One of the standout features of interactive visualizations is their ability to personalize the experience. Users can manipulate the data to see how different variables affect outcomes. For instance, in a research study on climate change, an interactive graph might allow users to adjust parameters like temperature or carbon emissions to observe potential future scenarios. This hands-on approach not only enhances understanding but also fosters a sense of ownership over the information, making it more memorable.
Moreover, interactive visualizations can cater to diverse audiences by providing multiple layers of information. Users can drill down into the data, accessing detailed insights without overwhelming them with too much information at once. For example, a healthcare study could present an overview of patient demographics in a pie chart, while allowing users to click on segments to reveal more detailed statistics about each group. This layered approach keeps the audience engaged while ensuring that the most relevant information is readily accessible.
However, creating effective interactive visualizations requires careful consideration of design and usability. Here are some key factors to keep in mind:
- User-Friendly Interface: Ensure that the controls for interaction are intuitive and easy to use, so that users can navigate the visualization without confusion.
- Responsive Design: Interactive visualizations should be adaptable to different devices, ensuring a seamless experience whether on a desktop, tablet, or smartphone.
- Feedback Mechanisms: Incorporate elements that provide feedback to the user, such as highlighting selected data points or displaying tooltips with additional information.
In conclusion, interactive visualizations not only enhance audience engagement but also deepen the understanding of complex research findings. By allowing users to interact with the data, researchers can create a more impactful and memorable experience that resonates with diverse audiences. As we continue to navigate an increasingly complex world filled with data, the role of interactive visualizations in research communication will only become more vital.
- What are interactive visualizations?
Interactive visualizations are graphical representations of data that allow users to engage with the information by manipulating variables and exploring different scenarios. - How do interactive visualizations improve understanding?
They allow users to explore data at their own pace, making complex information more digestible and memorable. - What are some examples of interactive visualizations?
Examples include dashboards, interactive maps, and data-driven infographics that allow user interaction. - Are interactive visualizations accessible to everyone?
When designed with accessibility in mind, interactive visualizations can cater to a wide range of audiences, including those with disabilities.

Accessibility Considerations
When it comes to data visualizations, accessibility is not just a buzzword; it’s a vital component that ensures everyone, regardless of their abilities, can engage with research findings. Imagine trying to decipher a complex graph when the colors are indistinguishable or the text is too small to read—frustrating, right? This is why researchers and designers must prioritize accessibility in their visual representations. By doing so, they not only widen their audience but also foster a more inclusive environment for knowledge sharing.
One effective approach to enhancing accessibility is to utilize color contrast effectively. High contrast between text and background colors is crucial for individuals with visual impairments. For instance, using dark text on a light background or vice versa can significantly improve readability. Moreover, it’s essential to avoid relying solely on color to convey information. Instead, incorporating patterns or textures in graphs can help those who are colorblind understand the data better.
Additionally, providing alternative text descriptions for visual elements is crucial. This allows screen readers to convey the information to visually impaired users. For example, if you have a bar chart, including a brief description that explains what the chart represents and the key takeaways can make a world of difference. Furthermore, ensuring that all interactive elements are navigable via keyboard shortcuts can enhance the experience for users who may not be able to use a mouse.
Another significant consideration is the use of simple language and clear layouts. Overly complex jargon can alienate certain audience members. By using straightforward language and structuring visualizations in a logical manner, you can help ensure that your research is accessible to a broader audience. This approach not only aids those with cognitive disabilities but also benefits anyone who is not familiar with the specific terminology of your field.
In summary, making data visualizations accessible is not just about compliance; it's about creating an inclusive environment where everyone can benefit from the insights your research provides. By focusing on color contrast, alternative text, navigability, and clear language, researchers can significantly enhance the impact of their work. Remember, when everyone can access and understand your research, the potential for real-world change increases exponentially.
- What is the importance of accessibility in data visualizations? Accessibility ensures that all individuals, including those with disabilities, can understand and engage with research findings, thus broadening the audience and enhancing the impact of the research.
- How can I make my data visualizations more accessible? Use high color contrast, provide alternative text descriptions, ensure keyboard navigability, and use simple language to reach a wider audience.
- Are there any tools available to help with accessibility? Yes, there are various tools and resources available, such as color contrast checkers and accessibility evaluation tools, that can guide you in creating accessible visualizations.

Best Practices for Creating Visualizations
Creating effective data visualizations is an art and a science that can significantly enhance the communication of research findings. To ensure your visualizations are not just pretty pictures but also powerful tools for understanding, it's essential to adhere to some best practices. First and foremost, simplicity and clarity are key. A cluttered visualization can overwhelm the audience and obscure the message. By keeping your visuals straightforward, you allow your audience to quickly grasp the essential insights without sifting through unnecessary information. Think of it like a well-designed roadmap; it should guide viewers directly to their destination without distractions.
In addition to simplicity, color and design choices play a crucial role in the effectiveness of your visualizations. The right color palette can enhance readability and draw attention to critical data points. For instance, using contrasting colors for different categories in a bar chart can help your audience distinguish between them easily. However, be cautious with color choices, as not everyone perceives colors the same way. Consider using color-blind friendly palettes to ensure inclusivity. Here’s a quick overview of how color choices can impact your visualizations:
| Color Choice | Impact |
|---|---|
| High Contrast | Enhances readability and focus |
| Pastel Colors | Creates a calming effect but may reduce visibility |
| Color-Blind Friendly Palettes | Ensures accessibility for all audiences |
Another vital aspect is to always consider your audience. Tailoring your visualizations to the specific needs and preferences of your target audience can greatly enhance their effectiveness. For example, if your audience consists of experts in a field, you might include more complex data and technical terms. Conversely, if your audience is the general public, it’s better to simplify your visuals and use layman’s terms. Engaging your audience starts with understanding who they are and what they need.
Moreover, don't forget the power of storytelling in your visualizations. Every data point has a story to tell, and by weaving these stories into your visuals, you can create a more compelling narrative that resonates with your audience. For example, instead of presenting a simple pie chart showing survey results, consider adding a brief narrative about what those results mean in the context of your research. This approach not only makes your visualization more engaging but also helps the audience connect emotionally with the data.
Lastly, always seek feedback on your visualizations. Sharing your drafts with colleagues or even potential audience members can provide valuable insights into what works and what doesn’t. This iterative process allows you to refine your visualizations and ensure they effectively communicate your research findings. Remember, the goal is not just to present data but to foster understanding and insight.
- What is the most important aspect of data visualization? The most important aspect is clarity. A clear visualization helps the audience understand the data without confusion.
- How can I make my visualizations more engaging? Incorporate storytelling elements and interactive features that allow users to explore the data themselves.
- What tools can I use for creating visualizations? There are various tools available, such as Tableau, Google Data Studio, and Microsoft Power BI, each offering unique features for different visualization needs.

Simplicity and Clarity
When it comes to data visualizations, are paramount. Imagine trying to navigate a complex maze without a clear path; that's what it feels like for audiences when faced with cluttered and convoluted visuals. The goal of any visualization is to convey information in a manner that is not only easy to understand but also engaging. By stripping away unnecessary elements, researchers can highlight the core message of their findings, allowing viewers to grasp the essential insights at a glance.
One of the best ways to achieve this is by focusing on key messages. Every visualization should have a clear purpose—whether it's to show a trend, compare data points, or illustrate a relationship. By identifying the main takeaway, researchers can eliminate superfluous details that may distract from the message. For example, if a researcher is presenting survey results, a simple bar chart can effectively communicate the differences in responses without overwhelming the audience with excessive data points or intricate designs.
Moreover, visual hierarchy plays a crucial role in guiding the viewer's eye. Important information should be emphasized through size, color, or placement, ensuring that audiences naturally focus on what matters most. For instance, using a bold color for the key data series in a graph can draw attention and make the information pop. This technique not only enhances understanding but also makes the visualization more visually appealing.
Another critical aspect of simplicity is the use of white space. Often overlooked, white space can significantly enhance clarity by preventing overcrowding. It allows the viewer's eyes to rest and helps them process the information presented. By strategically incorporating white space, researchers can create a clean and organized layout that facilitates comprehension.
To illustrate the importance of simplicity and clarity, consider the following table that compares effective and ineffective visualization practices:
| Effective Practices | Ineffective Practices |
|---|---|
| Clear labels and legends | Ambiguous or missing labels |
| Consistent color schemes | Inconsistent and distracting colors |
| Focused data points | Overloaded with too much data |
| Appropriate use of white space | Cluttered and cramped layouts |
In conclusion, the essence of effective data visualization lies in its ability to convey complex information in a simple and clear manner. By adhering to these principles, researchers can ensure that their findings resonate with their audience, driving home the significance of their work. Remember, less is often more when it comes to creating impactful visualizations, and a clear message can make all the difference in how research is perceived and understood.
- What is the main goal of data visualization?
The main goal is to present complex data in a clear and engaging manner, making it easier for audiences to understand and interpret the information. - Why is simplicity important in data visualization?
Simplicity helps prevent information overload, allowing viewers to focus on key messages and insights without distraction. - How can I improve the clarity of my visualizations?
Use clear labels, maintain a consistent color scheme, focus on essential data points, and incorporate white space to enhance readability.

Color and Design Choices
When it comes to data visualizations, play a pivotal role in how information is perceived and understood. Imagine walking into a room painted in bright, clashing colors versus one with a soothing palette; the latter invites you in, while the former may leave you feeling overwhelmed. Similarly, the right color scheme can enhance the clarity of your data, making it more engaging and easier to interpret.
Colors can evoke emotions and associations, and when utilized effectively, they can guide the viewer’s attention to the most critical elements of your visualization. For instance, using red to highlight negative trends and green for positive outcomes can create an immediate understanding of the data's implications. However, it's essential to consider color blindness and ensure that your visualizations are accessible to all audiences. Tools like color contrast checkers can help you choose combinations that are both visually appealing and functional.
Moreover, the overall design of your visualizations should prioritize simplicity and cohesion. Overly complicated designs can distract from the data itself. A clean design with ample white space allows the audience to focus on the key messages without unnecessary clutter. Think of your visualization as a well-composed photograph; the subject should be clear, with the background enhancing rather than detracting from the main focus.
Here’s a quick reference table that outlines some effective color choices and their psychological impacts:
| Color | Psychological Impact |
|---|---|
| Red | Stimulates urgency, attention, and excitement |
| Blue | Conveys trust, calmness, and professionalism |
| Green | Represents growth, health, and tranquility |
| Yellow | Evokes optimism, energy, and attention |
| Purple | Symbolizes creativity, luxury, and wisdom |
In conclusion, making thoughtful color and design choices in your data visualizations can significantly enhance their effectiveness. By focusing on clarity, accessibility, and emotional resonance, you can create visualizations that not only communicate your research findings but also engage and inspire your audience.
- What are the best colors to use for data visualizations? The best colors depend on the context of the data, but generally, it's advisable to use a limited palette that ensures clarity and accessibility.
- How can I make my visualizations accessible to color-blind individuals? Utilize color combinations that are distinguishable for color-blind users, such as using patterns in addition to colors, and consider tools that simulate color blindness.
- What design principles should I follow for effective visualizations? Focus on simplicity, clarity, and coherence. Avoid clutter and ensure that the key messages stand out.
Frequently Asked Questions
- What is data visualization?
Data visualization is the graphical representation of information and data. By using visual elements like charts, graphs, and maps, data visualization tools provide an accessible way to see and understand trends, outliers, and patterns in data.
- Why is data visualization important in research?
Data visualization is crucial in research because it simplifies complex data, making it easier for various audiences to comprehend and retain key findings. It enhances the impact of research by transforming raw data into engaging visuals that communicate insights effectively.
- What types of data visualizations are commonly used?
Common types of data visualizations include bar charts, line graphs, pie charts, infographics, and dashboards. Each type serves a unique purpose and is effective in conveying specific types of data, whether it's for comparison, trend analysis, or storytelling.
- How do interactive visualizations enhance audience engagement?
Interactive visualizations allow users to engage with the data by manipulating it, exploring different scenarios, and discovering personalized insights. This hands-on approach fosters a deeper understanding of the research findings and keeps audiences interested.
- What are some best practices for creating effective data visualizations?
Some best practices include maintaining simplicity and clarity to avoid overwhelming the audience, choosing appropriate color schemes for better readability, and ensuring that the visualizations are accessible to all users, including those with disabilities.
- How can I ensure my data visualizations are accessible?
To ensure accessibility, use clear fonts, high-contrast colors, and provide alternative text for images. Additionally, consider using tools that allow for screen reader compatibility and ensure that interactive elements are navigable via keyboard.
- Can data visualization improve research communication?
Absolutely! By transforming complex data into visual formats, researchers can communicate their findings more effectively, reach broader audiences, and increase the likelihood that their research will be understood and utilized.