How to Use Data Analytics for Research Insights
In today's fast-paced world, the ability to harness data analytics has become essential for researchers across various fields. Whether you're diving into social sciences, healthcare, or even marketing, the right data can illuminate paths that were previously obscured. Imagine trying to navigate a dense forest without a map; that's what research can feel like without the guidance of data analytics. This article will explore how you can leverage data analytics to enhance research outcomes, providing you with insights into methodologies, tools, and best practices that make the most of your data.
At its core, data analytics is the process of examining raw data to uncover trends, patterns, and insights that can significantly influence decision-making. Think of it as a detective sifting through clues to solve a mystery. The significance of data analytics in research cannot be overstated; it transforms decision-making processes by providing concrete evidence rather than relying solely on intuition or anecdotal observations. By employing data analytics, researchers can not only validate their hypotheses but also discover new avenues for exploration that they might not have considered otherwise.
When it comes to data analytics, there are four primary types that researchers should be familiar with: descriptive, diagnostic, predictive, and prescriptive. Each type serves a unique purpose and offers different insights, much like different lenses through which to view the same landscape. Understanding these types can empower researchers to select the most appropriate methods for their specific needs.
Descriptive analytics is all about summarizing historical data to identify trends and patterns. It provides a clear understanding of past events, which is crucial for informed decision-making. For instance, if a researcher is studying consumer behavior, descriptive analytics can reveal purchasing trends over time, helping them understand what products are popular and when. This foundational knowledge is essential for any further analysis.
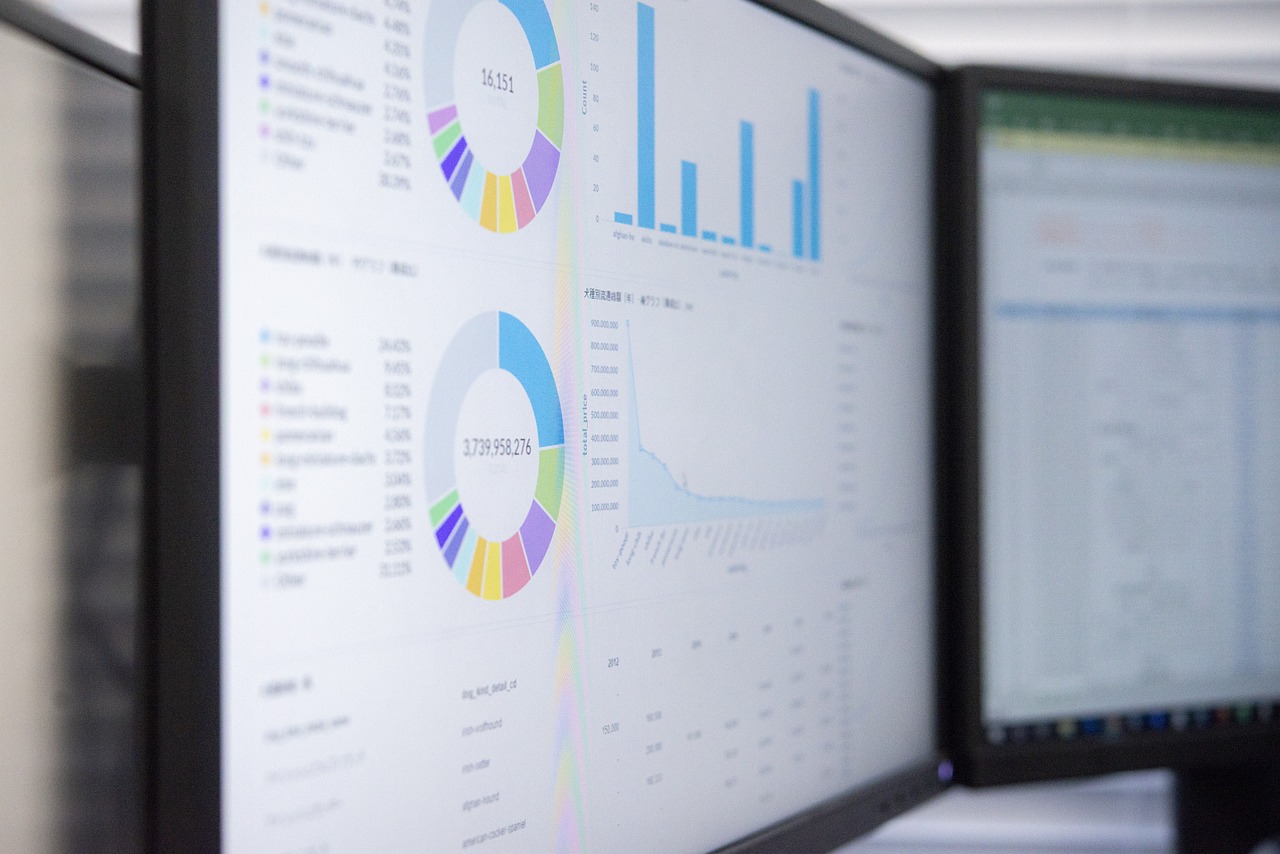
To enhance the understanding of descriptive analytics, effective data visualization techniques are paramount. Visual tools can transform complex datasets into easily digestible formats, making it simpler for researchers to communicate their findings. Techniques such as bar charts, line graphs, and heat maps can be incredibly useful. For example, a line graph depicting sales over time can provide immediate clarity on trends that might be buried in raw numbers.
Several tools are available for conducting descriptive analytics. Some popular software and platforms include:
- Excel: A versatile tool that many researchers are already familiar with.
- Tableau: Known for its powerful visualization capabilities.
- Google Analytics: Ideal for web and marketing research.
- R and Python: Programming languages that offer advanced statistical analysis.
Each of these tools has its strengths, and the choice often depends on the specific needs of the research project.
Predictive analytics takes things a step further by using historical data to forecast future outcomes. This type of analysis is particularly valuable in research fields where anticipating trends can lead to significant advantages. For example, in healthcare, predictive analytics can help identify potential outbreaks of diseases before they occur, allowing for proactive measures to be taken. By analyzing patterns, researchers can make educated guesses about what might happen next, which can be a game-changer in strategic planning.
Integrating data analytics into research methodologies requires strategic planning. It's not just about having the right tools; it's about knowing how to use them effectively. Researchers should start by defining their objectives clearly. What questions are they trying to answer? What data do they need to collect? Once these questions are answered, the next steps become much clearer.
Selecting the appropriate tools is crucial for successful data analysis. Factors to consider when choosing analytics software for research purposes include:
- User-Friendliness: Can you easily navigate the tool?
- Integration Capabilities: Does it work well with other tools you're using?
- Cost: Is it within your budget?
- Support and Resources: Are there tutorials or customer support available?
By carefully considering these factors, researchers can ensure they choose tools that will enhance, rather than hinder, their analytical processes.
Effective data collection methods are vital for accurate analysis. Researchers must ensure that they gather quality data that is relevant to their objectives. Techniques such as surveys, interviews, and observational studies can be employed to collect data. It's like gathering ingredients for a recipe; the quality of your ingredients will directly impact the final dish. Therefore, taking the time to develop a robust data collection strategy is essential for successful research outcomes.
1. What is data analytics?
Data analytics is the process of examining raw data to uncover trends and patterns that can inform decision-making.
2. Why is data analytics important in research?
Data analytics provides concrete evidence that can validate hypotheses and reveal new insights, enhancing the overall quality of research.
3. What are the types of data analytics?
The four primary types are descriptive, diagnostic, predictive, and prescriptive analytics, each serving a unique purpose.
4. How can I choose the right data analytics tools?
Consider factors such as user-friendliness, integration capabilities, cost, and available support when selecting tools.

Understanding Data Analytics
Data analytics is like the compass in the vast ocean of information, guiding researchers through uncharted waters to uncover hidden treasures of knowledge. By examining raw data, researchers can reveal trends and patterns that might otherwise remain obscured. This process is not just a technical endeavor; it’s a transformative journey that can significantly enhance decision-making processes in various fields of research.
Imagine you’re a detective sifting through a mountain of evidence. Each piece of data is a clue, and data analytics is the magnifying glass that helps you see the connections and implications more clearly. In today’s data-driven world, the ability to analyze and interpret data is more crucial than ever. It enables researchers to make informed decisions, validate hypotheses, and ultimately drive innovation.
Furthermore, the significance of data analytics in research cannot be overstated. It allows researchers to:
- Identify Trends: By analyzing historical data, researchers can spot trends that inform future research directions.
- Enhance Accuracy: Data analytics reduces the margin of error, leading to more reliable results.
- Support Evidence-Based Decisions: It empowers researchers to base their conclusions on solid data rather than intuition.
In essence, data analytics transforms raw numbers into meaningful narratives. It provides the tools necessary to not only understand what has happened in the past but also to predict what might happen in the future. As researchers delve deeper into their fields, leveraging data analytics becomes an indispensable part of their toolkit, ensuring they remain at the forefront of discovery.
As we explore the various types of data analytics in the following sections, keep in mind that each type serves a unique purpose and offers different insights that can be tailored to meet the specific needs of your research. Whether you’re looking to describe past events, diagnose issues, predict future outcomes, or prescribe actionable solutions, understanding the fundamentals of data analytics will empower you to harness its full potential.

Types of Data Analytics
Data analytics is not a one-size-fits-all solution; rather, it encompasses a variety of approaches tailored to specific research needs. Understanding the different types of data analytics is crucial for researchers who want to extract meaningful insights from their data. The four primary types of data analytics—descriptive, diagnostic, predictive, and prescriptive—each serve distinct purposes and offer unique advantages in the research landscape. Let’s delve into each type and explore how they can elevate your research efforts.
Descriptive analytics is like a storyteller that narrates the events of the past. By summarizing historical data, it enables researchers to identify patterns and trends that have occurred over time. Imagine trying to understand a complex novel without a summary; descriptive analytics provides that essential overview. This type of analytics answers questions such as "What happened?" and "How did we get here?" By examining data from previous studies, researchers can make informed decisions about their current or future projects.
To make the most out of descriptive analytics, effective data visualization techniques are essential. Visualizations can turn complex data sets into easily digestible formats, allowing researchers to quickly grasp insights. Tools like Tableau, Power BI, and Google Data Studio offer various visualization options, from bar charts to heat maps, that can help highlight trends and outliers. The clearer the visualization, the easier it is to communicate findings to stakeholders.
Several tools are available for conducting descriptive analytics, each with its own strengths. Here’s a quick look at some popular software that researchers often rely on:
| Tool | Description | Best For |
|---|---|---|
| Excel | A versatile spreadsheet tool for basic data analysis. | Small-scale projects and quick analyses. |
| SPSS | Statistical software for advanced analytics. | Social sciences and academic research. |
| R | A programming language for statistical computing. | Complex data manipulation and analysis. |
| Python | A programming language with libraries for data analysis. | Custom analyses and machine learning applications. |
Predictive analytics takes a step further by using historical data to forecast future outcomes. Think of it as a crystal ball that helps researchers anticipate trends and behaviors. By applying statistical algorithms and machine learning techniques, predictive analytics can answer questions like "What is likely to happen next?" or "How can we prepare for future scenarios?" This type of analytics is particularly valuable in fields such as healthcare, finance, and marketing, where understanding future trends can lead to proactive decision-making.
Integrating data analytics into research methodologies requires strategic planning. This section outlines essential steps for researchers to effectively incorporate data analytics.
Selecting the appropriate tools is crucial for successful data analysis. This subsection discusses factors to consider when choosing analytics software for research purposes.
Effective data collection methods are vital for accurate analysis. This part emphasizes various techniques researchers can use to gather quality data for analytics.
Q1: What is the primary difference between descriptive and predictive analytics?
A1: Descriptive analytics summarizes past data to identify trends, while predictive analytics uses historical data to forecast future outcomes.
Q2: Can I use multiple types of analytics in a single research project?
A2: Absolutely! Many research projects benefit from a combination of descriptive, diagnostic, predictive, and prescriptive analytics to provide comprehensive insights.
Q3: What tools are best for beginners in data analytics?
A3: Tools like Excel and Google Sheets are great starting points for beginners, as they offer user-friendly interfaces and basic analytical capabilities.
Q4: How important is data visualization in analytics?
A4: Data visualization is crucial as it helps to present complex data in a clear and understandable format, making it easier to communicate findings to various audiences.

Descriptive Analytics
Descriptive analytics is like the storyteller of the data world. It takes a look back at historical data and summarizes it, helping researchers understand what has happened in the past. Think of it as a rearview mirror that provides clarity on previous events, trends, and patterns. By analyzing this historical data, researchers can identify key insights that inform their future decisions. Imagine you're planning a road trip; you wouldn't just jump in the car without checking the map, right? Descriptive analytics is that map, guiding researchers through the maze of past data to ensure they make informed choices moving forward.
In the realm of research, descriptive analytics serves several crucial functions. It allows researchers to:
- Identify trends over time, which can reveal shifts in behaviors or outcomes.
- Summarize large datasets into manageable insights, making it easier to communicate findings.
- Highlight anomalies or unexpected results that may warrant further investigation.
One of the most powerful aspects of descriptive analytics is its ability to visualize data. Effective data visualization techniques can enhance the understanding of the insights derived from descriptive analytics. For instance, charts, graphs, and dashboards can transform raw data into compelling visual stories that are easier to interpret. When researchers can see their data visually represented, patterns become more apparent, and insights leap off the page. This is where tools like Tableau, Power BI, and Google Data Studio come into play, offering user-friendly interfaces that allow researchers to create stunning visualizations without needing advanced technical skills.
Moreover, the choice of tools for conducting descriptive analytics can significantly impact the quality of insights derived. Some popular tools that researchers often turn to include:
| Tool | Description |
|---|---|
| Excel | A versatile spreadsheet tool that offers basic data analysis and visualization capabilities. |
| Tableau | A powerful data visualization tool that helps create interactive and shareable dashboards. |
| R and Python | Programming languages that provide extensive libraries for data analysis and visualization. |
In conclusion, descriptive analytics is an essential component of the research process. It not only helps in summarizing and interpreting past data but also lays the groundwork for more advanced analytics. By applying descriptive analytics effectively, researchers can gain a clearer understanding of their data, leading to better decision-making and more impactful research outcomes.

Data Visualization Techniques
Data visualization is like turning a complex puzzle into a beautiful picture. When researchers dive into the depths of data, they often find themselves swimming in a sea of numbers and statistics. This is where come into play, acting as a lifebuoy that helps to make sense of the chaos. By transforming raw data into visual formats, researchers can easily identify trends, patterns, and outliers that might otherwise go unnoticed.
One of the most effective ways to visualize data is through charts and graphs. These tools can range from simple bar graphs to intricate heat maps, each serving a unique purpose in the storytelling of data. For example, a line chart can effectively illustrate changes over time, while a pie chart can depict the proportion of different categories within a dataset. The choice of visualization depends on the type of data being analyzed and the specific insights the researcher aims to communicate.
Moreover, interactive visualizations have gained popularity in recent years. These allow users to engage with the data, exploring different facets through clicks and hovers. Imagine a dashboard where you can filter data by various parameters—this not only enhances understanding but also encourages deeper exploration. Tools like Tableau and Power BI have made it easier than ever to create such dynamic visualizations, making data analysis not just informative but also enjoyable.
Another powerful technique is the use of infographics. These combine visuals with textual information, providing a comprehensive overview of complex data in an easily digestible format. Infographics can be particularly useful for conveying research findings to a broader audience, ensuring that even those without a statistical background can grasp the essential points. When done right, an infographic can be both eye-catching and informative, serving as a bridge between raw data and public understanding.
In addition to these techniques, it’s essential to consider the principles of effective design. A clear and concise visualization avoids overwhelming the viewer. Here are some key principles to keep in mind:
- Clarity: Ensure that your visuals are easy to interpret. Avoid clutter and unnecessary embellishments.
- Consistency: Use uniform colors and fonts to create a cohesive look across all visualizations.
- Context: Provide context for your data. Include labels, legends, and titles to help guide the viewer's understanding.
Lastly, it’s worth noting that the choice of color plays a crucial role in data visualization. Colors can evoke emotions and highlight key information, but they can also mislead if not used thoughtfully. For instance, using red to signify a negative trend can be effective, but overuse of bright colors might distract from the data itself. Therefore, a well-thought-out color palette can significantly enhance the effectiveness of your visualizations.
In conclusion, mastering data visualization techniques is essential for any researcher looking to extract insights from their data. By leveraging various tools and adhering to design principles, researchers can transform their findings into compelling visual stories that resonate with their audience, making complex data accessible and actionable.
Common Tools for Descriptive Analytics
When it comes to descriptive analytics, having the right tools at your disposal can make a world of difference. These tools not only help you summarize historical data but also enable you to visualize trends and patterns that might otherwise go unnoticed. Think of them as your trusty sidekicks in the quest for data-driven insights. Some of the most popular tools in this realm include:
- Microsoft Excel: A classic in the analytics world, Excel offers robust functionalities for data manipulation, including pivot tables and various graphing options. It's user-friendly and widely accessible, making it a go-to for many researchers.
- Tableau: Known for its powerful data visualization capabilities, Tableau allows users to create interactive and shareable dashboards. This tool is particularly useful for presenting data in a visually appealing format that makes insights easy to digest.
- Google Analytics: While primarily used for web data, Google Analytics provides valuable insights into user behavior and trends. It's a fantastic tool for researchers looking to understand how audiences interact with digital content.
- R and Python: For those who are a bit more tech-savvy, programming languages like R and Python offer powerful libraries for data analysis and visualization. They provide flexibility and depth for conducting more complex analyses.
Utilizing these tools can significantly enhance your research outcomes. For instance, a researcher examining consumer behavior might leverage Tableau to create a visually engaging presentation of their findings, making it easier to communicate insights to stakeholders. On the other hand, someone analyzing large datasets may prefer R for its statistical capabilities.
Moreover, the choice of tools often depends on the specific needs of the research project. For example, if you're conducting a survey and need to analyze the results quickly, Excel might be your best bet for its simplicity and speed. However, if you're looking to explore deeper correlations in your data, R or Python could provide the advanced functionalities necessary for a comprehensive analysis.
In summary, the landscape of descriptive analytics tools is rich and varied, catering to different skill levels and research needs. By selecting the right tool, researchers can not only streamline their data analysis process but also uncover insights that drive impactful decisions.
1. What is descriptive analytics?
Descriptive analytics involves summarizing historical data to identify trends and patterns. It helps researchers understand past events and make informed decisions based on those insights.
2. Why is data visualization important in descriptive analytics?
Data visualization transforms complex data into visual formats, making it easier to grasp insights quickly. It helps highlight trends and patterns that may not be immediately apparent in raw data.
3. Can I use free tools for descriptive analytics?
Yes, there are several free tools available, such as Google Analytics and basic versions of Excel, which can provide valuable insights without the need for a budget.
4. How do I choose the right tool for my research?
Consider factors such as your budget, the complexity of your data, your technical skills, and the specific insights you wish to gain when selecting a tool for descriptive analytics.

Predictive Analytics
Predictive analytics is like having a crystal ball that uses historical data to forecast future outcomes. Imagine being able to anticipate trends before they happen! This powerful tool enables researchers to make informed decisions based on patterns and probabilities derived from past data. It’s not just about guessing what might happen; it’s about leveraging data to provide a clearer picture of the future. For instance, in healthcare research, predictive analytics can help identify potential outbreaks of diseases by analyzing trends in patient data and environmental factors.
But how does it work? At its core, predictive analytics involves several key steps:
- Data Collection: Gathering relevant historical data from various sources.
- Data Processing: Cleaning and preparing the data for analysis.
- Modeling: Using statistical algorithms and machine learning techniques to create predictive models.
- Validation: Testing the models to ensure their accuracy and reliability.
- Implementation: Applying the models to real-world scenarios to make predictions.
This approach can be applied across various fields. For example, in marketing research, companies can predict customer behavior and tailor their strategies accordingly. In finance, predictive analytics can help assess risks and forecast market trends, allowing businesses to make strategic investments. The beauty of predictive analytics lies in its versatility and the depth of insights it can provide.
Moreover, the accuracy of predictive analytics is continually improving thanks to advancements in technology and data science. The use of big data and machine learning algorithms has revolutionized how we analyze data, making predictions more reliable than ever. However, it’s essential to remember that while predictive analytics can provide valuable insights, it is not infallible. The predictions are based on probabilities, and unexpected events can still occur.
In summary, predictive analytics offers a treasure trove of opportunities for researchers looking to enhance their studies and outcomes. By understanding the past and analyzing current data, researchers can make educated guesses about what lies ahead, ultimately driving better decision-making and strategic planning.

Implementing Data Analytics in Research
Integrating data analytics into research methodologies is not just a trend; it's a necessity in today's data-driven world. Imagine embarking on a journey without a map; that's what research feels like without the power of data analytics. To effectively incorporate data analytics, researchers need to engage in strategic planning that aligns with their specific research goals. The first step is to clearly define the research question. This will guide the selection of relevant data and analytics methods. For instance, if a researcher is investigating consumer behavior, understanding the demographic data and purchasing trends is crucial.
Once the research question is set, the next step is to choose the right tools for data analytics. Selecting appropriate software can feel overwhelming given the plethora of options available. Researchers should consider factors such as ease of use, compatibility with existing data sources, and the specific analytical capabilities they require. For example, tools like Tableau and Google Analytics are excellent for data visualization, while R and Python are powerful for statistical analysis.
Effective data collection methods are equally vital for accurate analysis. Researchers can utilize various techniques to gather quality data, such as surveys, experiments, and observational studies. Each method has its strengths and weaknesses, and the choice often depends on the research context. For instance, surveys can provide quantitative data quickly, while observational studies may offer deeper qualitative insights. It’s essential to ensure that the data collected is not only relevant but also reliable and valid. After all, the accuracy of the insights derived from data analytics hinges on the quality of the data.
Moreover, researchers should be mindful of the ethical considerations surrounding data collection and analysis. This includes ensuring informed consent from participants, maintaining data privacy, and being transparent about how data will be used. Ethical lapses can not only harm individuals but can also jeopardize the integrity of the research itself.
Finally, once the data is collected and analyzed, the findings must be communicated effectively. This is where data visualization plays a crucial role. Using graphs, charts, and infographics can help present complex data in a way that is easily digestible for various audiences. By making insights visually appealing, researchers can enhance understanding and encourage informed decision-making.
- What is the first step in implementing data analytics in research?
The first step is to clearly define the research question, which will guide the selection of relevant data and analytics methods. - How do I choose the right data analytics tools?
Consider factors such as ease of use, compatibility, and specific analytical capabilities required for your research. - What are effective methods for data collection?
Techniques can include surveys, experiments, and observational studies, each with its own strengths and weaknesses. - Why is ethical consideration important in data analytics?
Ethical considerations ensure the protection of participants' rights and the integrity of the research findings.

Choosing the Right Tools
When it comes to data analytics, selecting the right tools is like choosing the right gear for a mountain climb. Just as the right equipment can make the difference between reaching the summit or turning back, the right analytics tools can significantly impact your research outcomes. With a plethora of options available, it can be overwhelming to decide which tools will best suit your needs. So, what should you consider when making this crucial choice?
First and foremost, you need to evaluate the specific requirements of your research. Are you dealing with large datasets that require complex analysis, or are you looking for straightforward descriptive analytics? Understanding the scope of your project is key. For instance, if your research involves predictive analytics, you might want to look for tools that offer robust modeling capabilities, while descriptive analytics might be well-served by simpler visualization platforms.
Next, consider the user-friendliness of the software. Not all researchers are data scientists, and if you or your team are not particularly tech-savvy, a tool with a steep learning curve could hinder your progress. Look for platforms that offer intuitive interfaces and comprehensive support resources. Many tools come with tutorials, forums, and customer service that can guide you through the learning process. Here are some factors to keep in mind:
- Ease of Use: A user-friendly interface can save you time and frustration.
- Integration Capabilities: Ensure the tool can easily integrate with your existing systems and data sources.
- Scalability: Choose tools that can grow with your research needs.
Cost is another significant factor. While some analytics tools are free or offer free trials, others can be quite expensive. It’s essential to weigh the features and benefits against the price. Sometimes, investing in a premium tool can save you time and yield better insights in the long run. You might find that a more sophisticated tool provides features that can automate certain tasks, freeing you up to focus on analysis rather than data wrangling.
Finally, don't underestimate the power of community and support. Tools that have a vibrant user community can be invaluable. You can learn from others’ experiences, share tips, and troubleshoot issues together. Additionally, check if the vendor provides regular updates and improvements to their software. A tool that evolves with the industry will likely serve you better over time.
In conclusion, choosing the right tools for data analytics is a critical step in enhancing your research. By considering your specific needs, evaluating user-friendliness, assessing costs, and tapping into community support, you can make an informed decision that will elevate your research outcomes. Remember, the right tool is out there waiting to help you unlock the full potential of your data!
- What are some popular data analytics tools? Some widely used tools include Tableau, Microsoft Power BI, R, and Python libraries like Pandas and NumPy.
- How do I know if a tool is right for my research? Assess your research needs, budget, and the tool’s features to determine if it aligns with your goals.
- Can I use free tools for data analytics? Yes, there are many free tools available, but they may have limitations compared to paid versions.
- What is the importance of user support in analytics tools? Good user support can help you resolve issues quickly and improve your overall experience with the tool.

Data Collection Methods
When it comes to harnessing the power of data analytics in research, the first step is to gather quality data. Think of data collection as the foundation of a house; if the foundation is shaky, the entire structure is at risk. There are several methods researchers can utilize to collect data, each with its own strengths and weaknesses. Understanding these methods is crucial for ensuring that the data you analyze is both reliable and relevant.
One of the most common methods is surveys. Surveys can be conducted online, via phone, or in person, and they allow researchers to gather quantitative data from a large audience quickly. The beauty of surveys lies in their flexibility; researchers can tailor questions to meet specific research objectives. However, it's essential to design surveys carefully to avoid bias and ensure clarity. A poorly designed survey can lead to misleading results, much like a faulty compass can lead a traveler astray.
Another effective method is interviews. Unlike surveys, interviews provide a more in-depth understanding of participants' thoughts and feelings. They can be structured, semi-structured, or unstructured, allowing researchers to explore topics in detail. Interviews are particularly useful when researchers want to dive deeper into complex issues or gather qualitative data. However, they can be time-consuming and may require skilled interviewers to extract meaningful insights.
Focus groups are another popular data collection method. In a focus group, a small group of participants discusses a specific topic guided by a facilitator. This method is excellent for exploring group dynamics and generating rich qualitative data. Focus groups can reveal insights that individual surveys or interviews might miss, as participants build upon each other's ideas. However, managing group dynamics can be challenging, and dominant personalities may skew the results.
Additionally, researchers often utilize observational studies. This method involves watching subjects in their natural environment without interference. Observational studies can provide valuable insights into behaviors and interactions that may not be captured through surveys or interviews. However, they require careful planning and can be subject to observer bias, where the researcher's expectations influence their observations.
Finally, secondary data analysis is a method where researchers analyze existing data collected by others. This approach can save time and resources, especially if high-quality data is readily available. However, researchers must ensure that the secondary data is relevant to their study and that they understand its context. Relying solely on secondary data can sometimes lead to incomplete or outdated findings.
In summary, selecting the right data collection method is paramount for achieving accurate and actionable insights. Each method has its unique advantages and challenges, and often a combination of techniques can yield the best results. By being strategic in data collection, researchers can lay a solid foundation for their data analytics efforts, paving the way for insightful discoveries.
- What is the most effective data collection method? The most effective method depends on your research goals. Surveys are great for quantitative data, while interviews and focus groups excel in qualitative insights.
- How can I ensure the reliability of my data? Ensure your data collection methods are well-designed, avoid bias, and consider using multiple methods to triangulate your findings.
- What are the costs associated with data collection? Costs can vary widely depending on the method chosen. Online surveys may be less expensive than conducting in-person interviews or focus groups.
Frequently Asked Questions
- What is data analytics?
Data analytics is the process of examining raw data to identify trends, patterns, and insights. It plays a crucial role in research by transforming data into actionable information, enabling researchers to make informed decisions based on evidence rather than intuition.
- What are the different types of data analytics?
There are four primary types of data analytics: descriptive, diagnostic, predictive, and prescriptive. Each type serves a unique purpose: descriptive analytics summarizes past data, diagnostic analytics investigates reasons behind past outcomes, predictive analytics forecasts future trends, and prescriptive analytics suggests actions to achieve desired outcomes.
- How can descriptive analytics benefit my research?
Descriptive analytics helps researchers summarize historical data, making it easier to identify trends and patterns. By understanding what has happened in the past, researchers can make more informed decisions and improve their future research strategies.
- What tools are commonly used for descriptive analytics?
Several tools can facilitate descriptive analytics, including software like Microsoft Excel, Tableau, and Google Data Studio. These platforms help researchers visualize data and uncover insights effectively, enhancing the clarity of their findings.
- How does predictive analytics work?
Predictive analytics utilizes historical data to forecast future outcomes. By analyzing past trends, researchers can anticipate possible scenarios and make proactive decisions, which is particularly useful in fields such as healthcare, finance, and marketing.
- What steps should I take to implement data analytics in my research?
To effectively incorporate data analytics into your research, start by defining your objectives, selecting appropriate tools, and determining data collection methods. Planning is key to ensure that the analytics process aligns with your research goals.
- How do I choose the right analytics tools for my research?
When selecting analytics tools, consider factors such as ease of use, compatibility with your existing data systems, the specific features you need, and your budget. Choosing the right tools can significantly impact the effectiveness of your data analysis.
- What are effective data collection methods?
Effective data collection methods include surveys, interviews, experiments, and observational studies. The choice of method depends on the research objectives and the type of data needed for analysis. Ensuring quality data collection is essential for accurate analytics.